• Process Explorer 11.21 – update 3

    With this post we will conclude the general part of ProceXP 11.21. The final part will be related to various possible ways to use it in order to fix complicated issues (mostly virus/trojan related).

    Process

    When you have a process selected the items in the Process menu become active. You can access the same menu items by right-clicking on a process. The items enable you to do the following:

    Bring to Front – select this option to bring any windows owned by the selected process to the foreground.

    Set Priority – you can change the base priority of a process with this submenu. When you change the base priority of a process the system adjusts the priorities of threads within the process so that they remain at the same relative priority with respect to the new base priority.

    Set Affinity – on systems with multiple CPUs this menu item lets you bind the threads of a process to particular CPUs.

    Debug – choosing this menu item launches the debugger registered in HKEY_LOCAL_MACHINESoftwareMicrosoftWindows NTCurrentVersionAeDebug with the selected process as the command-line argument.

    Kill – this item terminates a process with the Terminate Process API. Note that a process terminated in this way is not warned of its termination and therefore does not write unsaved data it may have.

    Kill Process Tree – if the process pane is in the process tree sorting mode this menu item is available and allows you to kill a process and all of its descendants.

    Suspend – if you want a process to become temporarily inactive, so that a system resource such as network, CPU or disk, becomes available for other processes, you can suspend the process. Suspended processes show in a dark grey color. To resume a suspended process chose the Resume item from the process context menu.

    Restart – when you select this item Process Explorer terminates the highlighted process and starts the same image using the same command-line arguments. Note that the new instance may fail to run or behave differently if the original process ran in a different user account or had a different environment.

    Properties – this selection opens a property dialog that shows you more information about a process.

    Search Online – selecting this entry will result in Process Explorer launching the system’s configured Internet browser and initiating an Internet search for the selected process’ name.

    Find

    One of the common problems Process Explorer solves with ease is the question: what process has this file or directory open, or which processes have a particular DLL loaded?

    You can perform a handle and DLL search by selecting Find|Find Handle or DLL or by typing Ctrl+F. Searches are case insensitive substring searches of all of the handles opened and DLLs loaded on the system with the text you enter. Thus, to search for the process or processes that have c:directorysomefile.txt open enter enough text to make the search find only the results you are interested in e.g. “somefile”.

    The search dialog populates with the list of results indexed by process. Select a line in the results to have Process Explorer select the reported process and DLL or handle, and double-click on a line to have it do the same and dismiss the Search dialog.

    UserOn systems that include Terminal Services Process Explorer displays a Users menu that lists the currently connected sessions. Process Explorer creates a menu entry for each session that’s name includes the session’s session ID and the user logged into the session. Each entry opens a sub menu that has options for disconnecting, logging off, and sending a message to the session’s user. In addition, a Properties menu for each session entry opens a dialog box that lists detailed information about the session, including the IP address and name of the client connected to the session.

    The content of the Users menu is updated each time you open the menu to reflect current session information.

    It’s done for now. Now let me a few days to complete the “usage guide”…

  • Process Explorer 11.21 – update 2

    After too many months of silence, I’m back with the analysis of ProceXP. Now let’s have a look at the Menu “View”, that may seem not really important, but this is not true, as it contains various options that are the one which provide us the greatest control on the information we want.


    System Information – On Windows NT and higher the System Information entry in the View menu (or Ctrl+I) opens a dialog box that shows global system performance metrics like those shown in Task Manager. The information includes the amount of committed and available virtual and physical memory as well as paged and nonpaged kernel buffer usage.

    Graphs show the CPU usage history of the system as well as the committed virtual memory usage, and on Windows 2000 or higher systems an I/O graph shows I/O throughput history.  Red in the CPU usage graph indicates CPU usage in kernel-mode whereas green is the sum of kernel-mode and user-mode execution.  When committed virtual memory, which Task Manager labels in its graphs on Windows 2000 and higher as “PF Usage” and on NT 4 as “Mem Usage”, reaches the system Commit Limit, applications and the system become unstable. The Commit Limit is the sum of most of physical memory and the sizes of any paging files. In the I/O graph the blue line indicates total I/O traffic, which is the sum of all process I/O reads and writes, between refreshes and the pink line shows write traffic.

    When you move the mouse over the CPU graph a popup displays either on the far left or right of the graph that shows the CPU usage and name of the process that had the largest contribution to CPU usage at the corresponding point in time, as well as the time of the point. Similarly, time stamp information for a point is shown in the Commit graph. Finally, on the I/O graph the tooltip shows the process performing the most I/O at the time of the point, including the amount of data it read and wrote. The popups update as data moves under the mouse, but you can freeze a popup by right clicking and the move the mouse to unfreeze the popup.

    On systems with multiple CPUs the System Information dialog includes a Show one graph per CPU checkbox. Checking it switches the display into a per-processor view. Hyperthreaded (SMT) processors sharing the same core and NUMA processors sharing the same node are grouped together and the mouse tooltip shown when hovering over a graph displays the processor and core or node numbers. Note that the mouse tooltips for a processor graph show the name of the process that consumed the most CPU on the entire system at the associated time, not the process that consumed the most CPU on the particular CPU.

    Show Process Tree – By default Process Explorer sorts processes into the system process tree. The process tree reflects the parent-child relationship between processes where child processes are shown directly beneath their parent and right-indented. Processes that are left-justified are orphans; their parent has exited. To change the sort order simply click on a the column by which you wish to sort. To return the sort to the process tree select View|Show Process Tree, click the process tree toolbar button, or type Ctrl+T.

    Show Processes from all the users – When this option is selected, the Process Explorer will show (or not) the processes launched by your user only or by all the users (both System and “real” users). It is recommended to keep this option enabled when full details are required.

    Show Fractional CPU – When this option is selected Process Explorer shows CPU usage to two decimal places. This can be useful to identify processes that would otherwise appear idle, but that are performing background processing.

    Show New Processes – When enabled Process Explorer scrolls the Process view to bring into view new processes. If this option is not enabled, you’ll just see the process list as a snapshot (if a process is closed or open it will not show).

    Show Unnamed Handles – By default, Process Explorer shows only handles to object that have names. Select the Show Unnamed Handles item under the View menu to have Process Explorer list all the handles opened by a selected process, even those to objects that are nameless. Note that Process Explorer consumes significantly more CPU resource when this option is selected.

     Opacity – You can make the Process Explorer window partially transparent so that windows beneath it show through on systems that support it by making a selection under the View|Opacity menu item.

    Show Lower Pane / Lower Pane View

    Views – The Process Explorer window shows by default two panes: the upper pane is always a process list and the bottom either shows the list of DLLs loaded into the process selected in the upper pane, or the list of operating system resource handles (files, Registry keys, synchronization objects) the process has open; the view mode determines which information is shown in the bottom pane. To switch the view, use the View|Lower Pane View menu item, the corresponding toolbar button (which toggles), or the Ctrl+D (DLL view) and Ctrl-H (handle view) accelerator keys.

    If you are only interested in seeing the processes running on your system You can hide the lower pane by selecting View|Hide Lower Pane, the corresponding toolbar button, the Ctrl+L accelerator, or by dragging the pane divider to the bottom of the Process Explorer window. You can bring back the lower pane by selecting View|Show Lower Pane, typing Ctrl+L or selecting the toolbar button again.

    Refresh Now – Well, if you need to refresh the view… click this option.

    Update Speed – This is the speed of the refresh.

    Organize Column Sets – Columns and Column Sets

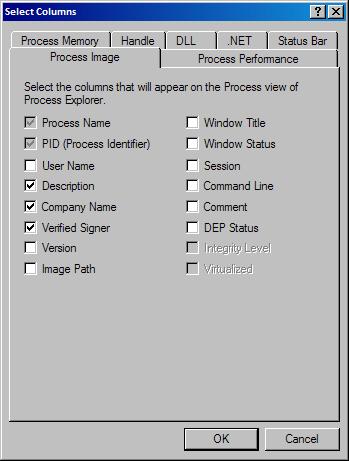
    Column Selection/ Save Column Set/ Load Column Set/ Select Columns – The information Process Explorer displays in its main window is fully configurable. You can reorder columns by dragging them to their new position. To select which columns of data you want visible in each of the views and the status bar, choose View|Select Columns or right-click on a column header and use Select Columns from the resulting context menu. A column selection editor opens that let’s you pick the columns you want to enable for the Process, DLL, handle panes, and status bar.

    Column Sets – You can save a column configuration and its associated sort settings by choosing View|Save Column Set. Process Explorer will prompt you to name the column set. You can load a saved column set by selecting it in the View|Load Column Set menu or by entering its associated accelerator keys. To reorder or rename existing column sets go to View|Organize Column Sets to open the column set organizer.

    Next part will cover the last menus: Process, Find, Users and Help. 

    Thank you.