Today we’ll go inside that blue window that most of times it’s mainly useless and cryptic, saying that something bad has happened to our OS, but what it was exactly it’s still a mystery for us. It’s a way to shutdown immediately the OS before further problems can happen.
First thing to say, when Windows crashes badly, it’s very difficult to see an error window with a clear and easy to read error message. In fact the OS crashed and the BSOD is just a basic function that tells you about an issue and, if Windows has been properly configured, it will save a full or partial memory dump to your disk (most of the times under c:windowsminidump under Windows XP/VISTA or under c:windowsmemory.dmp under Windows 7 – anyway is taken from the registry key HKEY_LOCAL_MACHINESYSTEMCurrentControlSetControlCrashControl).
Microsoft Windows allows you to read the memory dump you’ve saved (full instructions are on Microsoft KB at:http://support.microsoft.com/kb/315263) but you will have to install the debugging tools and make good use of multiple command line based instructions.
In order to make faster and easier troubleshooting of the BSOD, Nirsoft has created BlueScreenView that is a good tool that will easily analyze and make you understand which component/driver has failed.
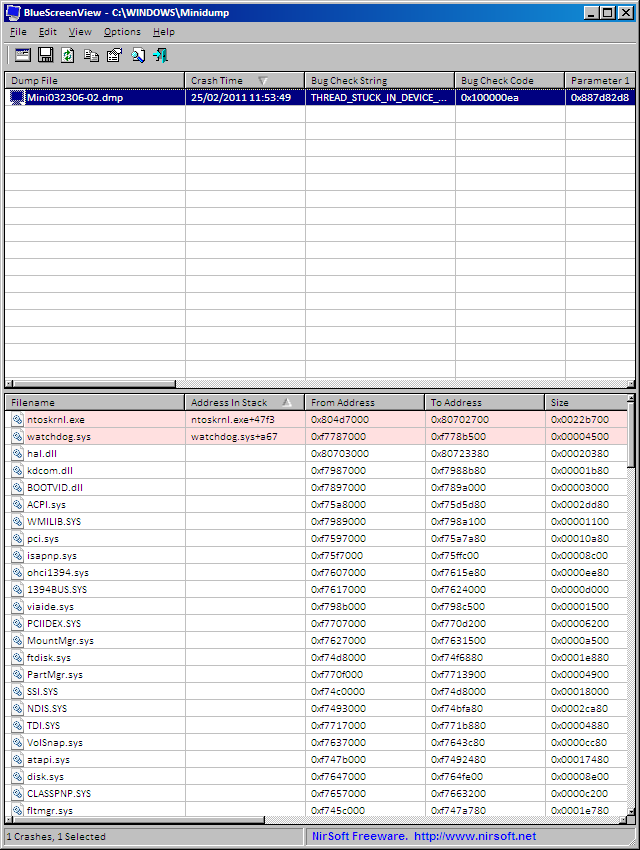
When you start BlueScreenView you’ll see that it will automatically identify where the minidumps are (if any) and the minidumps will be in the upper pane and the drivers involved in the crash will be listed in the lower pane.
In the lower pane you’ll notice that some files will be highlighted in pink. Those files are the ones directly involved with the crash. All the other were loaded at that time, but Windows hasn’t identified them as part of the issue. If you double click on those files you’ll see more details:
The same happens if you double click on the minidump itself in the upper pane:
Please note the “Caused by” field that clearly states which drivers has caused the crash. Obviously we need to think that nay driver may fail not only because of a bug in its code, but it can fail because of a bug in the OS itself or in some other component’s code. This tool is very good in telling us which component has failed but this is the first step of troubleshooting. To be honest most of the times the identified culprit is the real one (a damaged file, a new driver, some test software installed). So we can restore a good copy of the file, or use a different version of the driver and the problem will disappear.
In the menu “Options” you can configure what to see in the lower pane:
“All Drivers”: see the list of all drivers loaded during the crash;
“Only Drivers found in stack”: display all the drivers involved in the crash;
“DumpChk Output”: Displays the output of DumpChk (that is the Microsoft tool used to troubleshoot the dumps;
“Blue Screen in XP Style”: display the BSOD in a similar way it appeared when it happened:
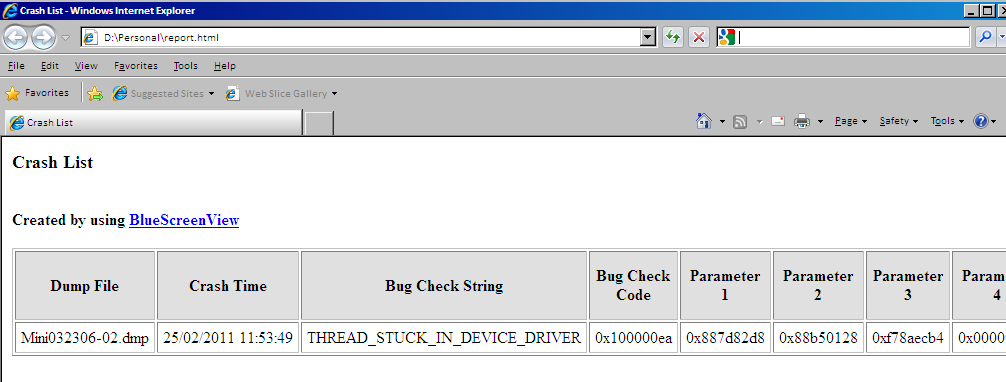
The last function we are going to see is the function to export the crash dump file list in html format. In the “View” menu, you can see the option to export to HTML so you can choose to export the whole list or just the ones you’ve highlighted.
I hope that you’ll have luck in fixing all those BSOD you see everyday on tons of different machines. BlueScsreenView will help you a lot out there…


Leave a Reply