Where is connecting your machine? Are all the connections legitimate? Is somebody connecting to your machine? It’s very important to know about the various open TCP and UDP connections as some of them can be the clear indication that some Trojan is using your connection or that maybe somebody is trying to access your system.
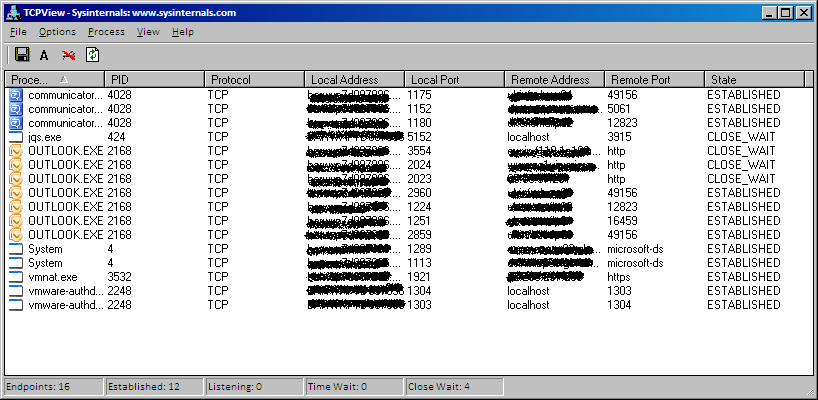
Microsoft Windows is shipped with the command line utility Netstat that is commonly used to list all the connections opened on a machine and troubleshoot them. However its output is an old-style, text only list of connections, so it can be hard to use or clearly understand its content. That’s why the Sysinternals team at Microsoft has created TCPView. This is a free program that shows you a detailed listings of all TCP and UDP endpoints exactly as Netstat would do, but in a clear and easy-to-read graphical interface.
All the local and remote addresses endpoints and the state of TCP connections is displayed.
You can download the latest version from http://technet.microsoft.com/en-us/sysinternals/bb897437
Starting from Windows XP (and moving through Vista, 7 or Server 2008) TCPView also reports the name of the process that owns the connection.
When you start TCPView it will enumerate all active TCP and UDP endpoints, resolving all IP addresses to their domain name versions. You can use a toolbar button or menu item to toggle the display of resolved names (Options -> Resolve Addresses). On Windows XP systems (or higher), TCPView shows the name of the process that owns each endpoint.
As explained in the brief instructions that come with the application, TCPView updates every second, but you can use the Options -> Refresh Rate menu item to choose a different time (1, 2, 5 seconds or paused).
Endpoints that change state from one update to the next are highlighted in yellow and those that are deleted are shown in red. New endpoints are shown in green.
TCPView offers two interesting functions out of the box:
- Kill processes
- Close connections
This means that if you can identify some strange process connecting to something strange, you can close this connection and monitor the process to see if it keeps opening the connection again, until you may decide that is the time to kill the process.
Sometimes it’s good to close a connection, not because it’s a Virus/Trojan that is opening it, but because an application can go to a “Not Responding” state when is waiting for incoming data from a network source that is a not reliable or that is taking too long to answer. If you just close the connection, there is a good chance that the process will be in a “responding” state again and you’ll not lose data as it would happen if you would have closed the process instead.
When you right click on a process/connection, you’ll see a small menu that will give you the option to Kill the process or Close the connection.
Another option you can appreciate in the context menu is “Whois”. If you want to have more info on the remote server, click choose this option and TCPView will search on the Internet the Whois information.
Please note that I’ve noticed that if you are using a Proxy Server or VPN connection, the Whois option is not available. In this case, you’ll have to do the Whois manually, then…
For troubleshooting purposes you should consider enabling the option”Show Unconnected Endpoints” under the Options menu (or by pressing Ctrl+U). If this option is enabled, you’ll see not only the existing connections, but you’ll be able to see which ports are open on your system. You may discover that something is keeping opened some strange port…
You can also save TCPView’s output window to a file using the “Save” icon. The output will be a standard TXT file.
TCPView includes Tcpvcon, a command-line version with the same functionality (basically a more clear to read Netstat with fewer options.
Tcpvcon usage is similar to that of the built-in Windows netstat utility:
Usage: tcpvcon [-a] [-c] [-n] [process name or PID]
| -a | Show all endpoints (default is to show established TCP connections); |
| -c | Print output as CSV; |
| -n | Don’t resolve addresses; |
| process | Only show endpoints owned by the process specified |
With tcpvcon you cannot kill any process, just see the opened ports/connections. But its default output it’s clearer than netstat. I would recommend to save the output in a text file so you’ll be able to review it easily. You can do so by running in a Dos box the tcpvcon using this syntax: tcpvcon > filename.txt
A file called “filename.txt” will be created and you’ll have the connection info available for a later check.


Recent Comments